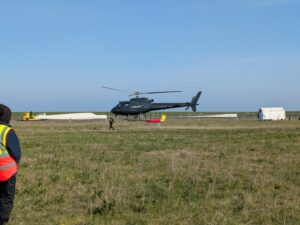
Following an extended dry period in the Netherlands, the risk of wildfires has significantly increased. On 3 April 2025, a wildfire broke out near Ede, and on 12 April another fire ignited near Drunen—both caused by exceptionally dry conditions this spring. These are not isolated incidents. In fact, prolonged dry spells are becoming more common, as shown by meteorological data collected over recent decades. This trend points to shifting climate patterns in northwestern Europe, increasing the frequency and intensity of such events.
The resulting smoke plumes were detected using the KNMI’s nationwide network of Automated Lidar Ceilometers (ALCs). These high-precision instruments (specifically the Lufft CHM 15k systems) are designed to measure the vertical structure of the atmosphere in real-time. Operating 24/7, they detect aerosols, cloud bases, mixing layers, and atmospheric stratification. Their sensitivity to backscattered light allows them to visualise fine-scale vertical movements of particles in the atmosphere, such as wildfire smoke, even hundreds of metres above ground. Their integration into both national and international ALC networks ensures that Dutch data directly contributes to broader European atmospheric monitoring efforts.
Wildfire smoke influences multiple atmospheric processes. It affects air quality, alters how sunlight is scattered or absorbed, and changes how air masses mix and move. These impacts manifest across various domains: from public health to solar energy forecasting, and from daily weather to global climate models. The more data we can gather, across timescales, locations, and atmospheric layers, the better we can understand the effects. Local measurements like these shape global models, connecting Dutch observations to international atmospheric knowledge.
Within Ruisdael Observatory, observations like these are not isolated but integrated components in a high-resolution, multi-instrument observation system. Ground-based sensors, satellite data, and atmospheric models converge to offer a dynamic view of the Dutch atmosphere as part of an interconnected system. The detection of wildfire plumes illustrates how this infrastructure can register and help explain the real-time impact of unexpected events.
The smoke plumes from the April wildfires were visualised by Steven Knoop (KNMI) and animated by Frédérik Ruys (KNMI). This visualisation now forms part of a living dataset, showing how even local events shape the air we share.
Data from events like this gain insight into how local incidents ripple through the larger system. It enables science, policy, and society to respond more precisely to a changing climate.


