During Covid spring 2020, KNMI reported incredibly blue skies. This week, they once again reported bright blue skies. How do these days compare with those of 2020? KNMI did the same calculation as back then to determine an objective degree of ‘blueness’. The results? The blueness of the sky during the current week is similar to that during the lockdown.
Cleaner air during corona lockdown Interestingly, the situation in terms of air traffic and industry is very different now than it was then: during the covid lockdown, air pollution emissions were much lower than normal, leading to cleaner air overall. Yet back in 2020, KNMI found that the sky can also be very blue in situations with more or less normal emissions. The high solar radiation and blue skies in spring 2020 had much more to do with the meteorological situation than with the exceptional conditions due to the lockdown at the time (see this study).
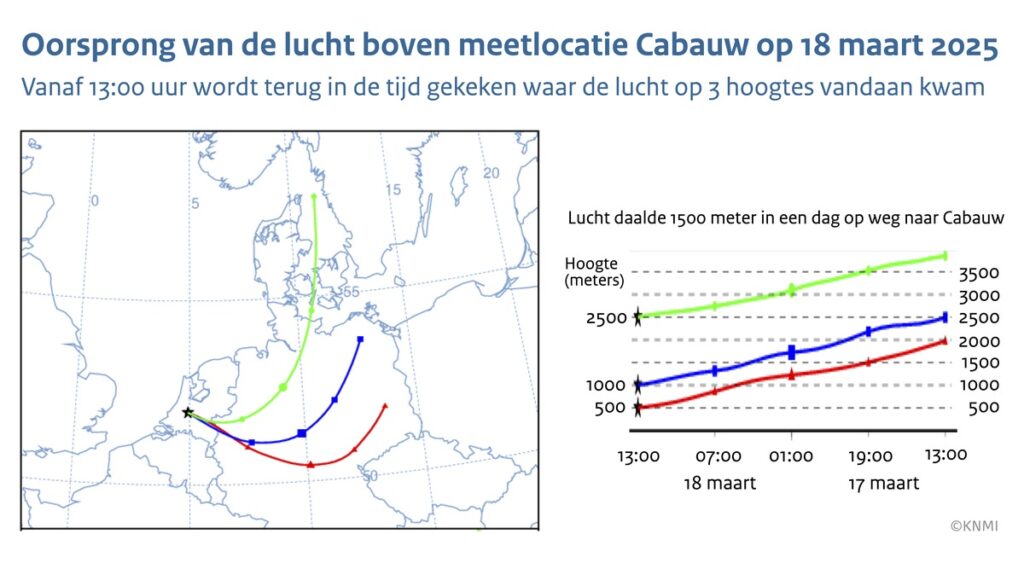
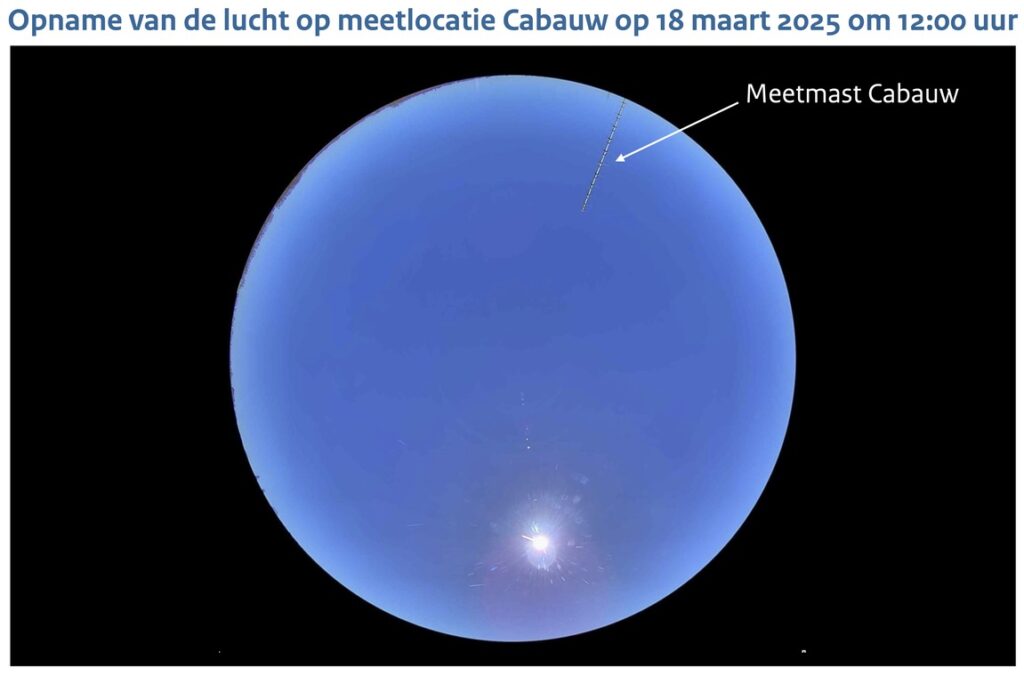
Supply of clean air on 18 March This week, a high-pressure area defined our weather with an absence of low clouds and a very dry upper air so that aircraft streaks dissolved quickly. The origin of the air in the Netherlands on Tuesday 18 March was over eastern Germany and Scandinavia and, moreover, it dropped along the way (Figure 1). The result was clean air with exceptionally few suspended dust particles (aerosols). Aerosols scatter the different colours of sunlight relatively more evenly than air molecules, making the air whiter. So fewer aerosols means a bluer colour. The air was also very dry, which further contributed to the blueness on 18 March (Figure 2).
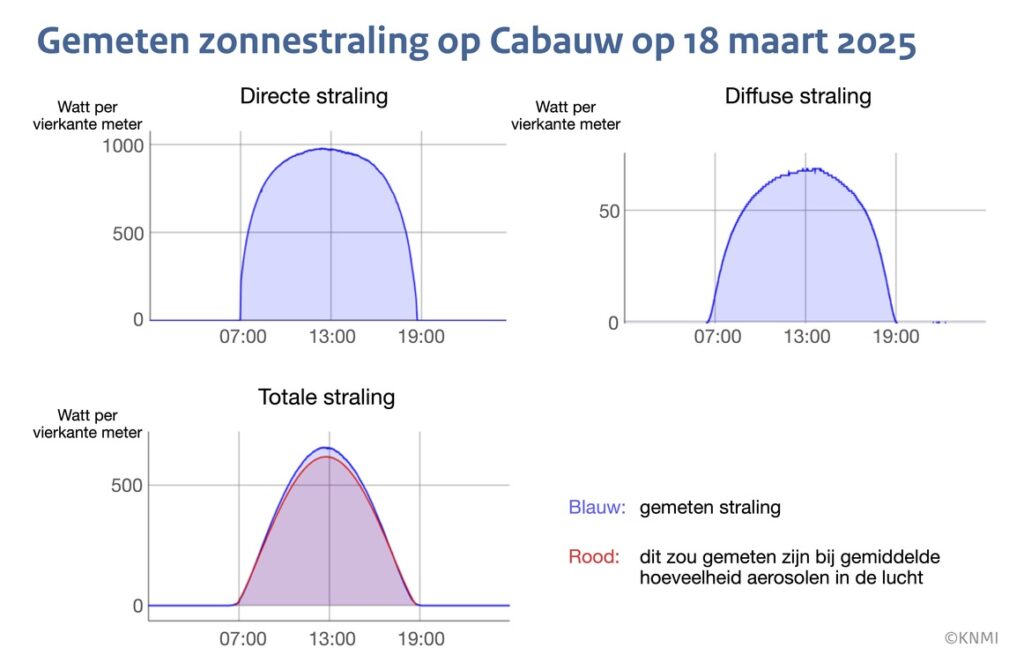
Sky on 18 March as blue as during Covid lockdown The radiation measurements taken by KNMI at the Ruisdael Observatory in Cabauw give almost perfectly smooth curves for 18 March (Figure 3). Direct radiation from the sun is very high, while diffuse radiation, which is scattered in the atmosphere and comes from all other directions, is actually very low. Based on these measurements, they calculate a blueness index. This index comes out to 71%, the same as on 22 March 2020, which was the bluest spring day in the measurement series so far. An index of 100% corresponds to the blueness of an atmosphere consisting only of air molecules, without aerosols (this is called a Rayleigh atmosphere).
Skies on March 19 also cloudless but less blue On Wednesday 19 March, the sky was still cloudless and the course of solar radiation in Cabauw during the day was as smooth as a day earlier. One big difference, however, was that the air was coming from the south instead of the northeast. Roughly speaking, both aerosols and water vapour were twice as high as the previous day. All in all, this led to a significantly lower blueness index of 59%.
Wind plays key role Studying this kind of situation teaches us that the Netherlands lies at a crossroads of air types: we may be dealing with highly polluted air (often from the Rijnmond or Ruhr regions) but also with very clean air. If cloud-free conditions are then added, the sky can turn very blue. Thus, this week, five years after the first Covid lockdown, the blue skies of that time have been matched.
Find the full KNMI climate report by Wouter Knap and Jan Fokke Meirink with sources here.